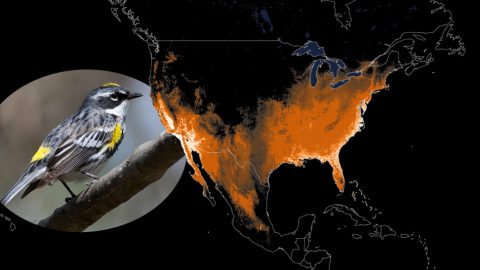
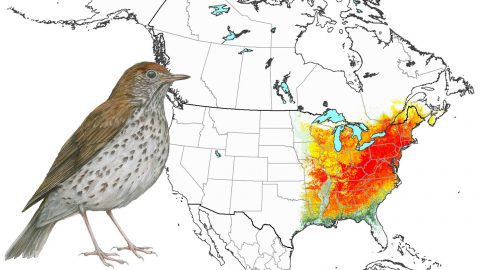
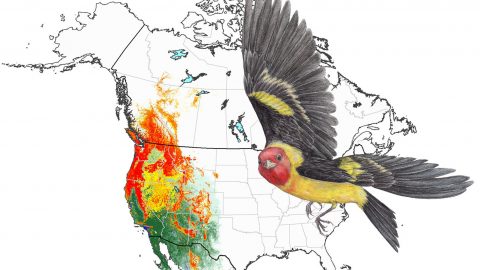
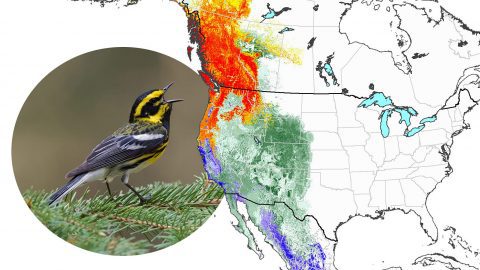
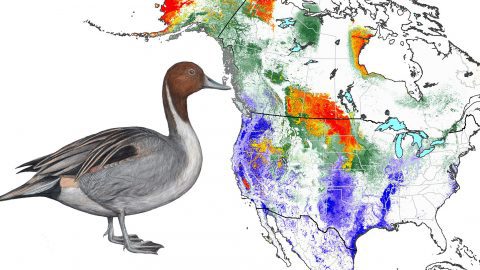
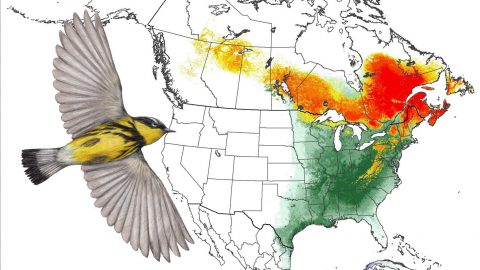
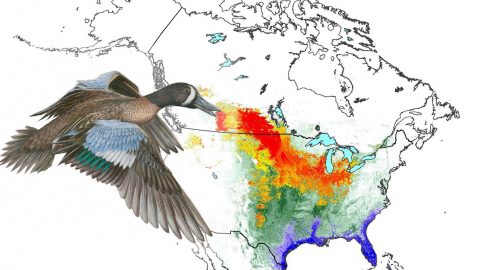
Species Abundance Maps
Year-round distribution maps illustrate how migratory birds connect habitats and countries. These birds depend on internationally coordinated conservation efforts for survival.
Click on the species links below to view two types of maps:
- an animated map depicting the distribution and abundance of each species during all 52 weeks of the year
- a year-round abundance map that shows breeding, migration, and winter abundance on one map. Both types of maps are based on complex computer models, taking advantage of millions of citizen-science records contributed to eBird.