Western Tanager
About the Maps
The animated map shows the Western Tanager’s predicted distribution and relative abundance across all 52 weeks of the year. The animation illustrates the migratory movements of each species as its populations travel across North America. The brighter the color, the higher the expected count of the species on a standardized eBird count.
The data used to generate this animation were produced using a statistical model to predict the relative abundance of the population at specific times and locations by relating observations of birds from eBird to local environmental features derived from NASA remote sensing data. Please note that because these maps represent models of predicted abundance, they are intended to illustrate broad patterns of connectivity across regions and are not intended to accurately depict local distributions in any given week. As more and more eBird data become available, the accuracy of these predictive models will improve.
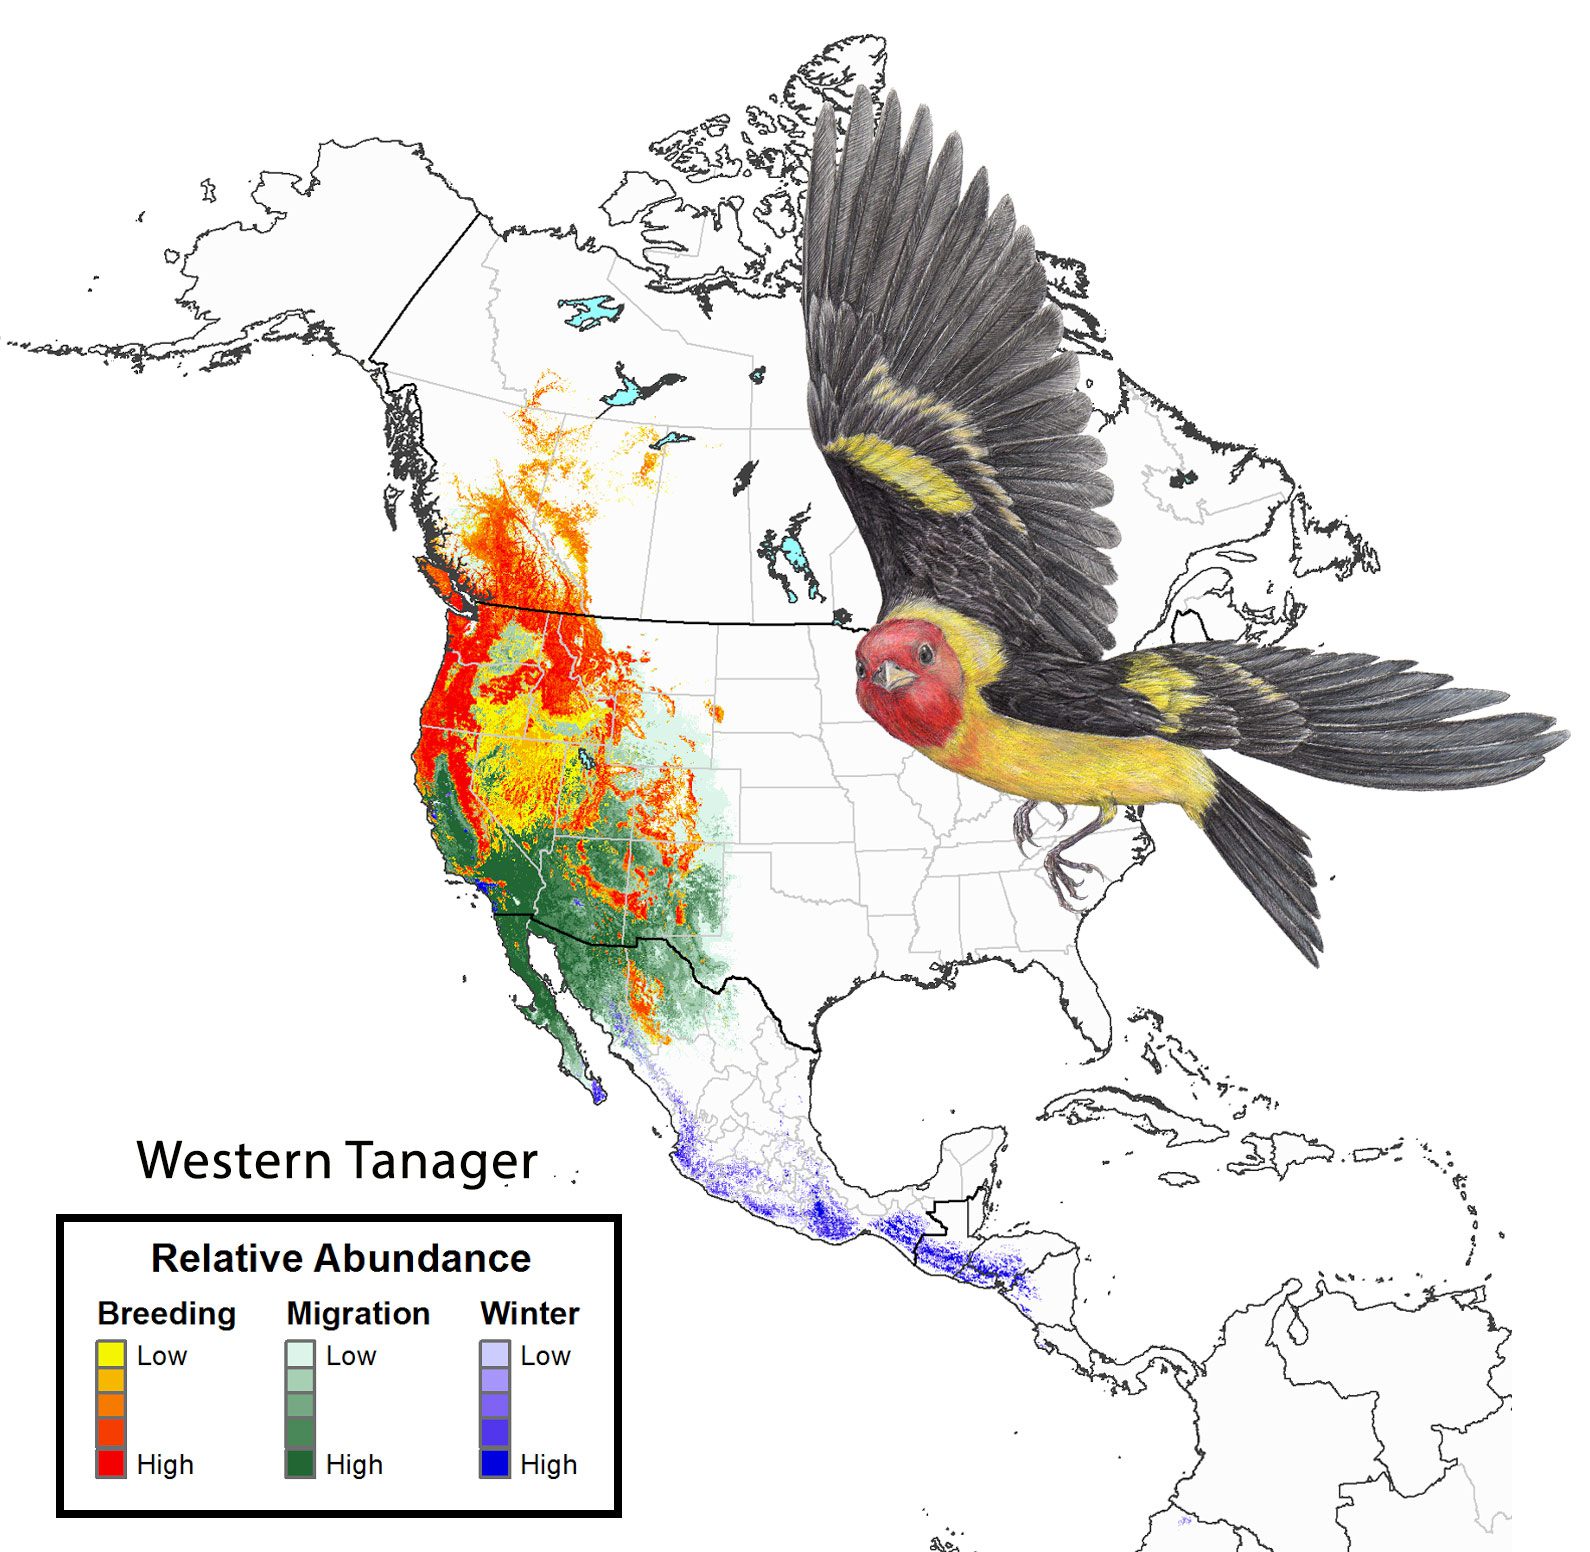
The lower map represents the average predicted relative abundance within the breeding season (red scale), in winter (blue scale), and during fall and spring migration (combined: green scale). These maps are the best representation we have of the total year-round distribution and abundance for migratory species, illustrating connections between regions and major habitats.
About Western Tanager Abundance and Distribution
The showy Western Tanager is one of many species connecting temperate forests in the western U.S. and Canada with tropical dry forests in the Pacific lowlands of Mexico and Central America. They breed in coniferous as well as oak and riparian forests from southeastern Alaska and western Canada to southern California and Arizona. Migrations occur throughout the western U.S. and northwestern Mexico. Wintering birds also occur in drier oak and pine-oak forests in the mountains of western and southern Mexico. Western Tanagers have shown steadily increasing populations since 1970.
More about Western Tanager at All About Birds.