Methods
Conservation Status Assessment
The 2016 State of North America’s Birds (SONAB) report is based on a conservation status assessment of 1,154 native bird species that breed in the continental U.S., Canada, and Mexico, as well as oceanic birds that regularly occur in waters off these three countries. Every bird species was assessed throughout its range and annual cycle. This assessment employs biological criteria to evaluate distinct components of vulnerability, including population size, distribution, threats and population trend. The process was developed and refined over many years (Hunter et al. 1993, Carter et al. 2000, Panjabi et al. 2001, Panjabi et al. 2005, Panjabi et al. 2012) and has been updated in response to external peer review (Beissinger et al. 2000) and partner input. It is explained in detail in the Partners in Flight Handbook on Species Assessment (Panjabi et al. 2012).
Although Partners in Flight originally applied this assessment to all landbirds in the U.S. and Canada (Rich et al. 2004), it was recently expanded to include all bird species occurring in Mexico (Berlanga et al. 2010). For this report, the State of North America’s Birds science team applied identical methods to assess all North American taxa, seeking expert review for scores applied to shorebirds, waterbirds, seabirds, and waterfowl. All assessment scores, and associated information on every species, is housed in the Avian Conservation Assessment Database. The Resources section of this site includes a species assessment summary used in this report as well as a downloadable version of the entire data table.
Each species was assigned a numerical score from 1 to 5 for each of six biological factors that assess largely independent aspects of vulnerability at the rangewide or North American scale: Population Size (PS), Breeding Distribution (BD), Nonbreeding Distribution (ND), Threats to Breeding (TB), Threats to Nonbreeding (TN), and Population Trend (PT). Each score reflects the degree of vulnerability inherent to the species due to that factor, ranging from low (1) to high (5) vulnerability.
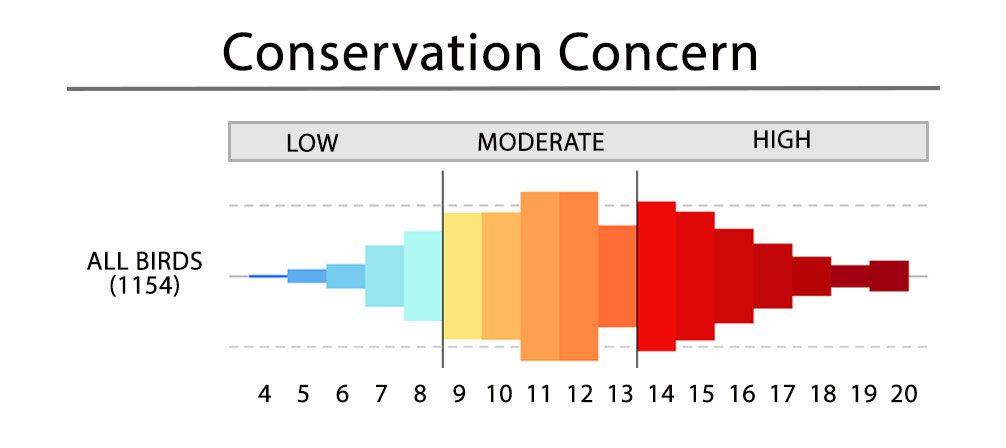
For each species we calculated a Combined Breeding Score (TB + BD + PT + PS) and a Combined Nonbreeding Score (TN + ND + PT + PS) and selected the higher of the two as the Maximum Combined Conservation Score (CCSmax). This score can range from 4 for a widespread, relatively secure species, to 20 for a species of the very highest concern. Species with CCSmax ≥ 14, or species with CCSmax = 13 and PT = 5 (steeply declining trend) were identified as comprising the SONAB Watch List; these species are of highest vulnerability to extinction based on elevated scores across multiple factors..
Analysis Methods for State of North America’s Birds
We categorized each species’ overall conservation concern status as low, moderate, or high. High concern species were those included on the SONAB Watch List. Moderate concern were species with a maximum combined score > 8 but not high enough to warrant inclusion on the Watch List. Species were considered low concern if their Maximum Combined Conservation Score was 8 or less.
The sizes of the bars in the report’s bar graphs reflect, for a given group of species, the proportions of species that are low (blue), moderate (orange), and high concern (red, i.e., these are species on the Watch List). The bars for all habitats are aligned to the division between moderate and high concern, so that the red bars to the right of the centering line provide a quick visual comparison of the proportion of species on the Watch List.
Composite population trajectories for Coasts and Grasslands
The composite population trajectories in the Coasts and Grasslands sections of the report were created using the same approach applied in the 2012 State of Canada’s Birds and the U.S. State of the Birds reports for 2009 and 2014. Briefly, the composite population trajectory (i.e., the trendline) represents the average population status of species in the group, relative to the start year. The average is calculated using a hierarchical Bayesian statistical model that accounts for the precision of each species’ population status information. The Coasts graph used population status estimates for each species, derived from analyses of three shorebird migration surveys that use the same survey protocol: the International Shorebird Survey, organized by the Manomet Center for Conservation Sciences; and the Atlantic Canada Shorebird Survey and the Ontario Shorebird Survey, both of which are organized by Environment and Climate Change Canada. The Grasslands graph used population status estimates derived from the North American Breeding Bird Survey. Note: the vertical scaling of these composite trajectory graphs is not linear. The nonlinear scaling is necessary to reflect the fact that proportional changes in population size are also nonlinear (e.g., a 100% increase, a doubling, is required for a population to recover from a 50% decrease in population size).
Modeling distribution and abundance of selected species
For selected species with adequate data, we developed predictive models of distribution and abundance to illustrate patterns of migration and connectivity across regions and habitats of North America. The relative abundance estimates visualized in the Species Abundance Maps were based on bird observation data from eBird (Sullivan et al. 2014) , a rapidly growing citizen-science program administered by Cornell Lab of Ornithology. This data was used to develop statistical models using the Spatio-Temporal Exploratory Model (STEM) framework (see Fink et al. 2010, 2014; Johnston et al. 2015). The models learned the associations between observed patterns of bird occurrence and abundance and local land cover characteristics. Local land cover descriptions were derived from NASA remote sensing data. These models were then used to produce one daily abundance estimate per week for all 52 weeks of the year at 3 million terrestrial locations with a resolution of 3 km across North America. Variation in detectability associated with the search effort was controlled by standardizing the estimates to be the expected count of the species on a search conducted from 7:00 A.M. to 8:00 A.M. while traveling 1 km on the given day at the given location by a typical eBirder.
Literature Cited
Beissinger, S.R., J.M. Reed, J.M. Wunderle, Jr., S.K. Robinson, and D.M. Finch. 2000. Report of the AOU Conservation Committee on the Partners in Flight species prioritization plan. Auk 117:549–561.
Carter, M.F., W.C. Hunter, D.N. Pashley, and K.V. Rosenberg. 2000. Setting conservation priorities in the United States: the Partners in Flight approach. Auk 117:541–548.
Fink, D., W.M., Hochachka, B. Zuckerberg, D.W. Winkler, B. Shaby, M. Arthur Munson, G.J. Hooker, M. Riedewald, D. Sheldon, S. Kelling. 2010. Spatiotemporal exploratory models for large-scale survey data. Ecological Applications 20(8):2131-2147.
Fink, D., T. Damoulas, N.E. Bruns, F.A. La Sorte, W.M. Hochachka, C. Gomes, and S. Kelling. 2014. Crowdsourcing meets ecology: hemisphere-wide spatiotemporal species distribution models. Artificial Intelligence Magazine 35(2):19–29.
Hunter, W.C., M.F. Carter, D.N. Pashley, and K. Baker. 1993. The Partners in Flight prioritization scheme. Pages 109–119 in Status and Management of Neotropical Migratory Birds (D. Finch and P. Stangel, eds.). USDA Forest Service General Technical Report RM-229. USDA Forest Service, Fort Collins, Colorado.
Johnston, A., D. Fink, M.D. Reynolds, W.M. Hochachka, B.L. Sullivan, N.E. Bruns, E. Hallstein, M.S. Merrifield, S. Matsumoto, and S. Kelling. 2015. Abundance models improve spatial and temporal prioritization of conservation resources. Ecological Applications 25:1749–1756. doi:10.1890/14-1826.1
Panjabi, A., C. Beardmore, P. Blancher, G. Butcher, M. Carter, D. Demarest, E. Dunn, C. Hunter, D. Pashley, K. Rosenberg, T. Rich, and T. Will. 2001. The Partners in Flight handbook on species assessment and prioritization. Version 1.1, December 2001. Partners in Flight Technical Series No. 3. Partners in Flight.
Panjabi, A.O., E.H. Dunn, P.J. Blancher, W.C. Hunter, B. Altman, J. Bart, C.J. Beardmore, H. Berlanga, G.S. Butcher, S.K. Davis, D.W. Demarest, R. Dettmers, W. Easton, H. Gomez de Silva Garza, E.E. Iñigo-Elias, D.N. Pashley, C.J. Ralph, T.D. Rich, K.V. Rosenberg, C.M. Rustay, J.M. Ruth, J.S. Wendt, and T.C. Will. 2005. The Partners in Flight handbook on species assessment. Version 2005. Partners in Flight Technical Series No. 3. Partners in Flight.
Panjabi, A.O., P. J. Blancher, R. Dettmers, and K.V. Rosenberg. 2012. The Partners in Flight handbook on species assessment. Version 2012. Partners in Flight Technical Series No. 3. Partners in Flight.
Sullivan, B.L., J.L. Aycrigg, J.H. Barry, R.E. Bonney, N. Bruns, C.B. Cooper, T. Damoulas, A.A. Dhondt, T.G. Dietterich, A. Farnsworth, D. Fink, J.W. Fitzpatrick, T. Fredericks, J. Gerbracht, C. Gomes, W.M. Hochachka, M.J. Iliff, C. Lagoze, F.A. La Sorte, M. Merrifield, W. Morris, T.B. Phillips, M. Reynolds, A.D. Rodewald, K.V. Rosenberg, N.M. Trautmann, A. Wiggins, D.W. Winkler, W. Wong, C.L. Wood, J. Yu, and S. Kelling. 2014. The eBird enterprise: an integrated approach to development and application of citizen science. Biological Conservation 169 (2014) 31–40. doi: 10.1016/j.biocon.2013.11.003