Methods
Documenting Impacts of Farm Bill Conservation
To document the conservation benefits of Farm Bill programs, our team scoured numerous published studies and reports to find the most compelling examples. All of the numerical and other examples illustrated in this State of the Birds special report are linked directly to their primary sources in the online version of the report. Some other important and frequently cited sources for the benefits of Farm Bill programs for birds include:
Overlapping Bird Distribution and Farm Bill Programs
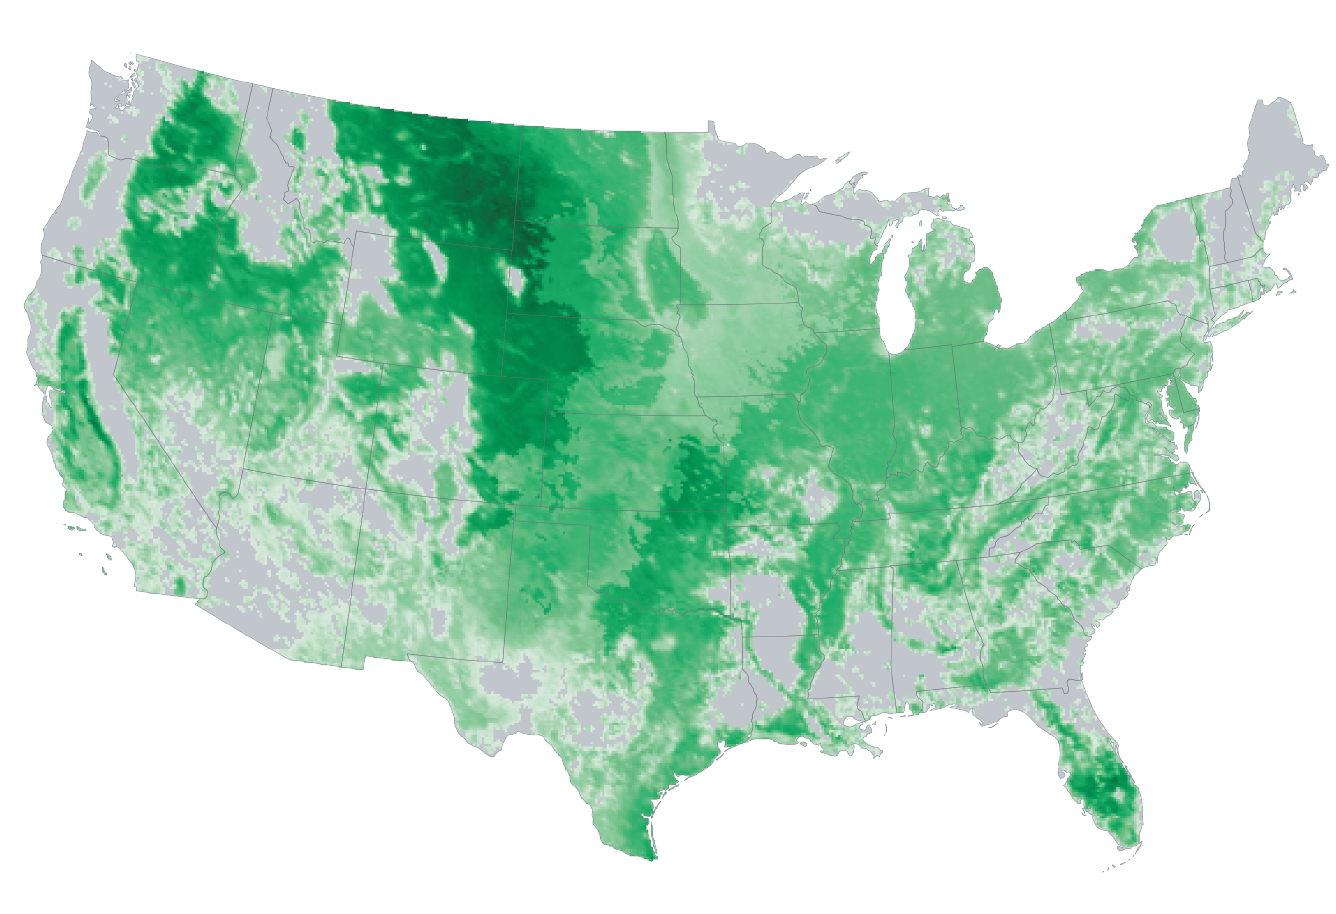
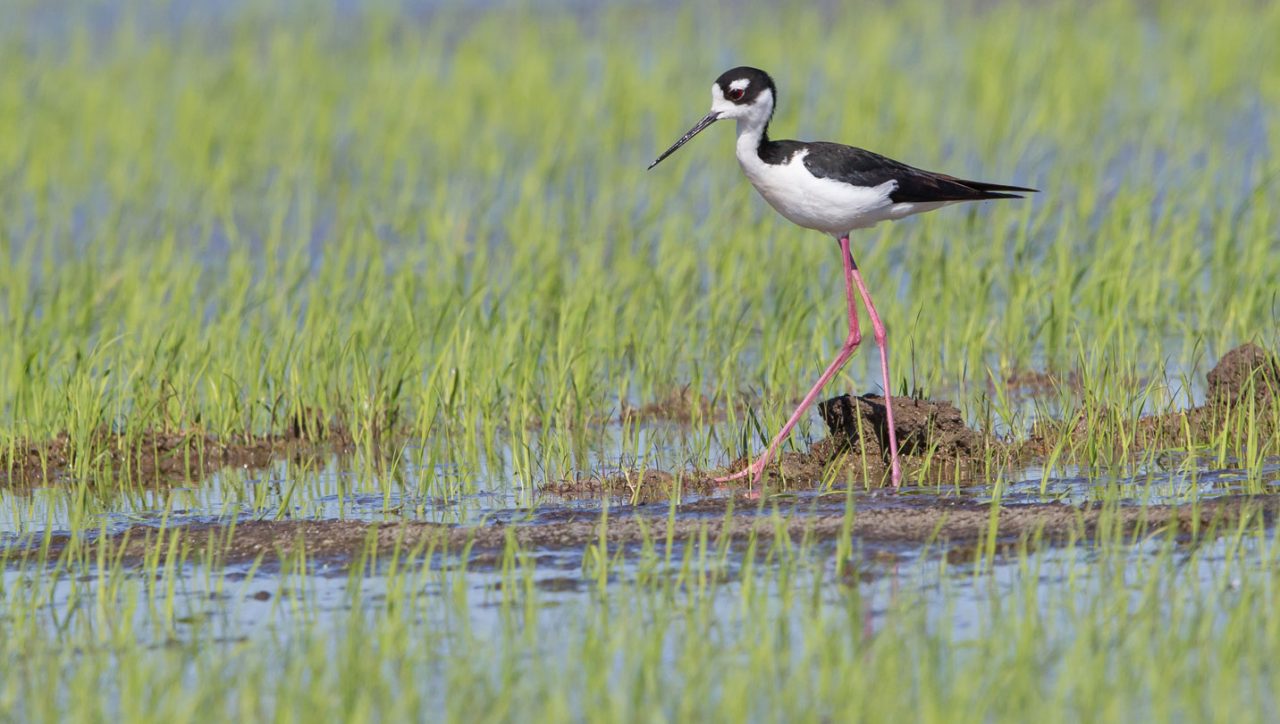
Many grassland bird species are widely distributed across the United States and are often familiar and iconic features of rural and agricultural landscapes. To illustrate the potential benefits of Farm Bill conservation practices to grassland birds, we selected the Eastern and Western Meadowlarks, which together cover the combined breeding range of most grassland-dependent species. We used recently developed models of predicted abundance for both meadowlarks, based on data from eBird, averaged across the breeding season of each species. The modeling methods, which take into account geographic and seasonal variability in observer effort and relationships with land cover and other environmental variables, are described fully in Fink et al. 2010, Fink et al. 2014, and Johnston et al. 2015. For this map of meadowlark abundance, the distributions of the two species were scaled to 0–1 before averaging, and to aid visualization, the bottom 10% of abundances were set to 0 and the abundance was square-root transformed. Model outputs were provided by Daniel Fink, and the abundance map visualization was created by Matt Strimas-Mackey, both at Cornell Lab of Ornithology.
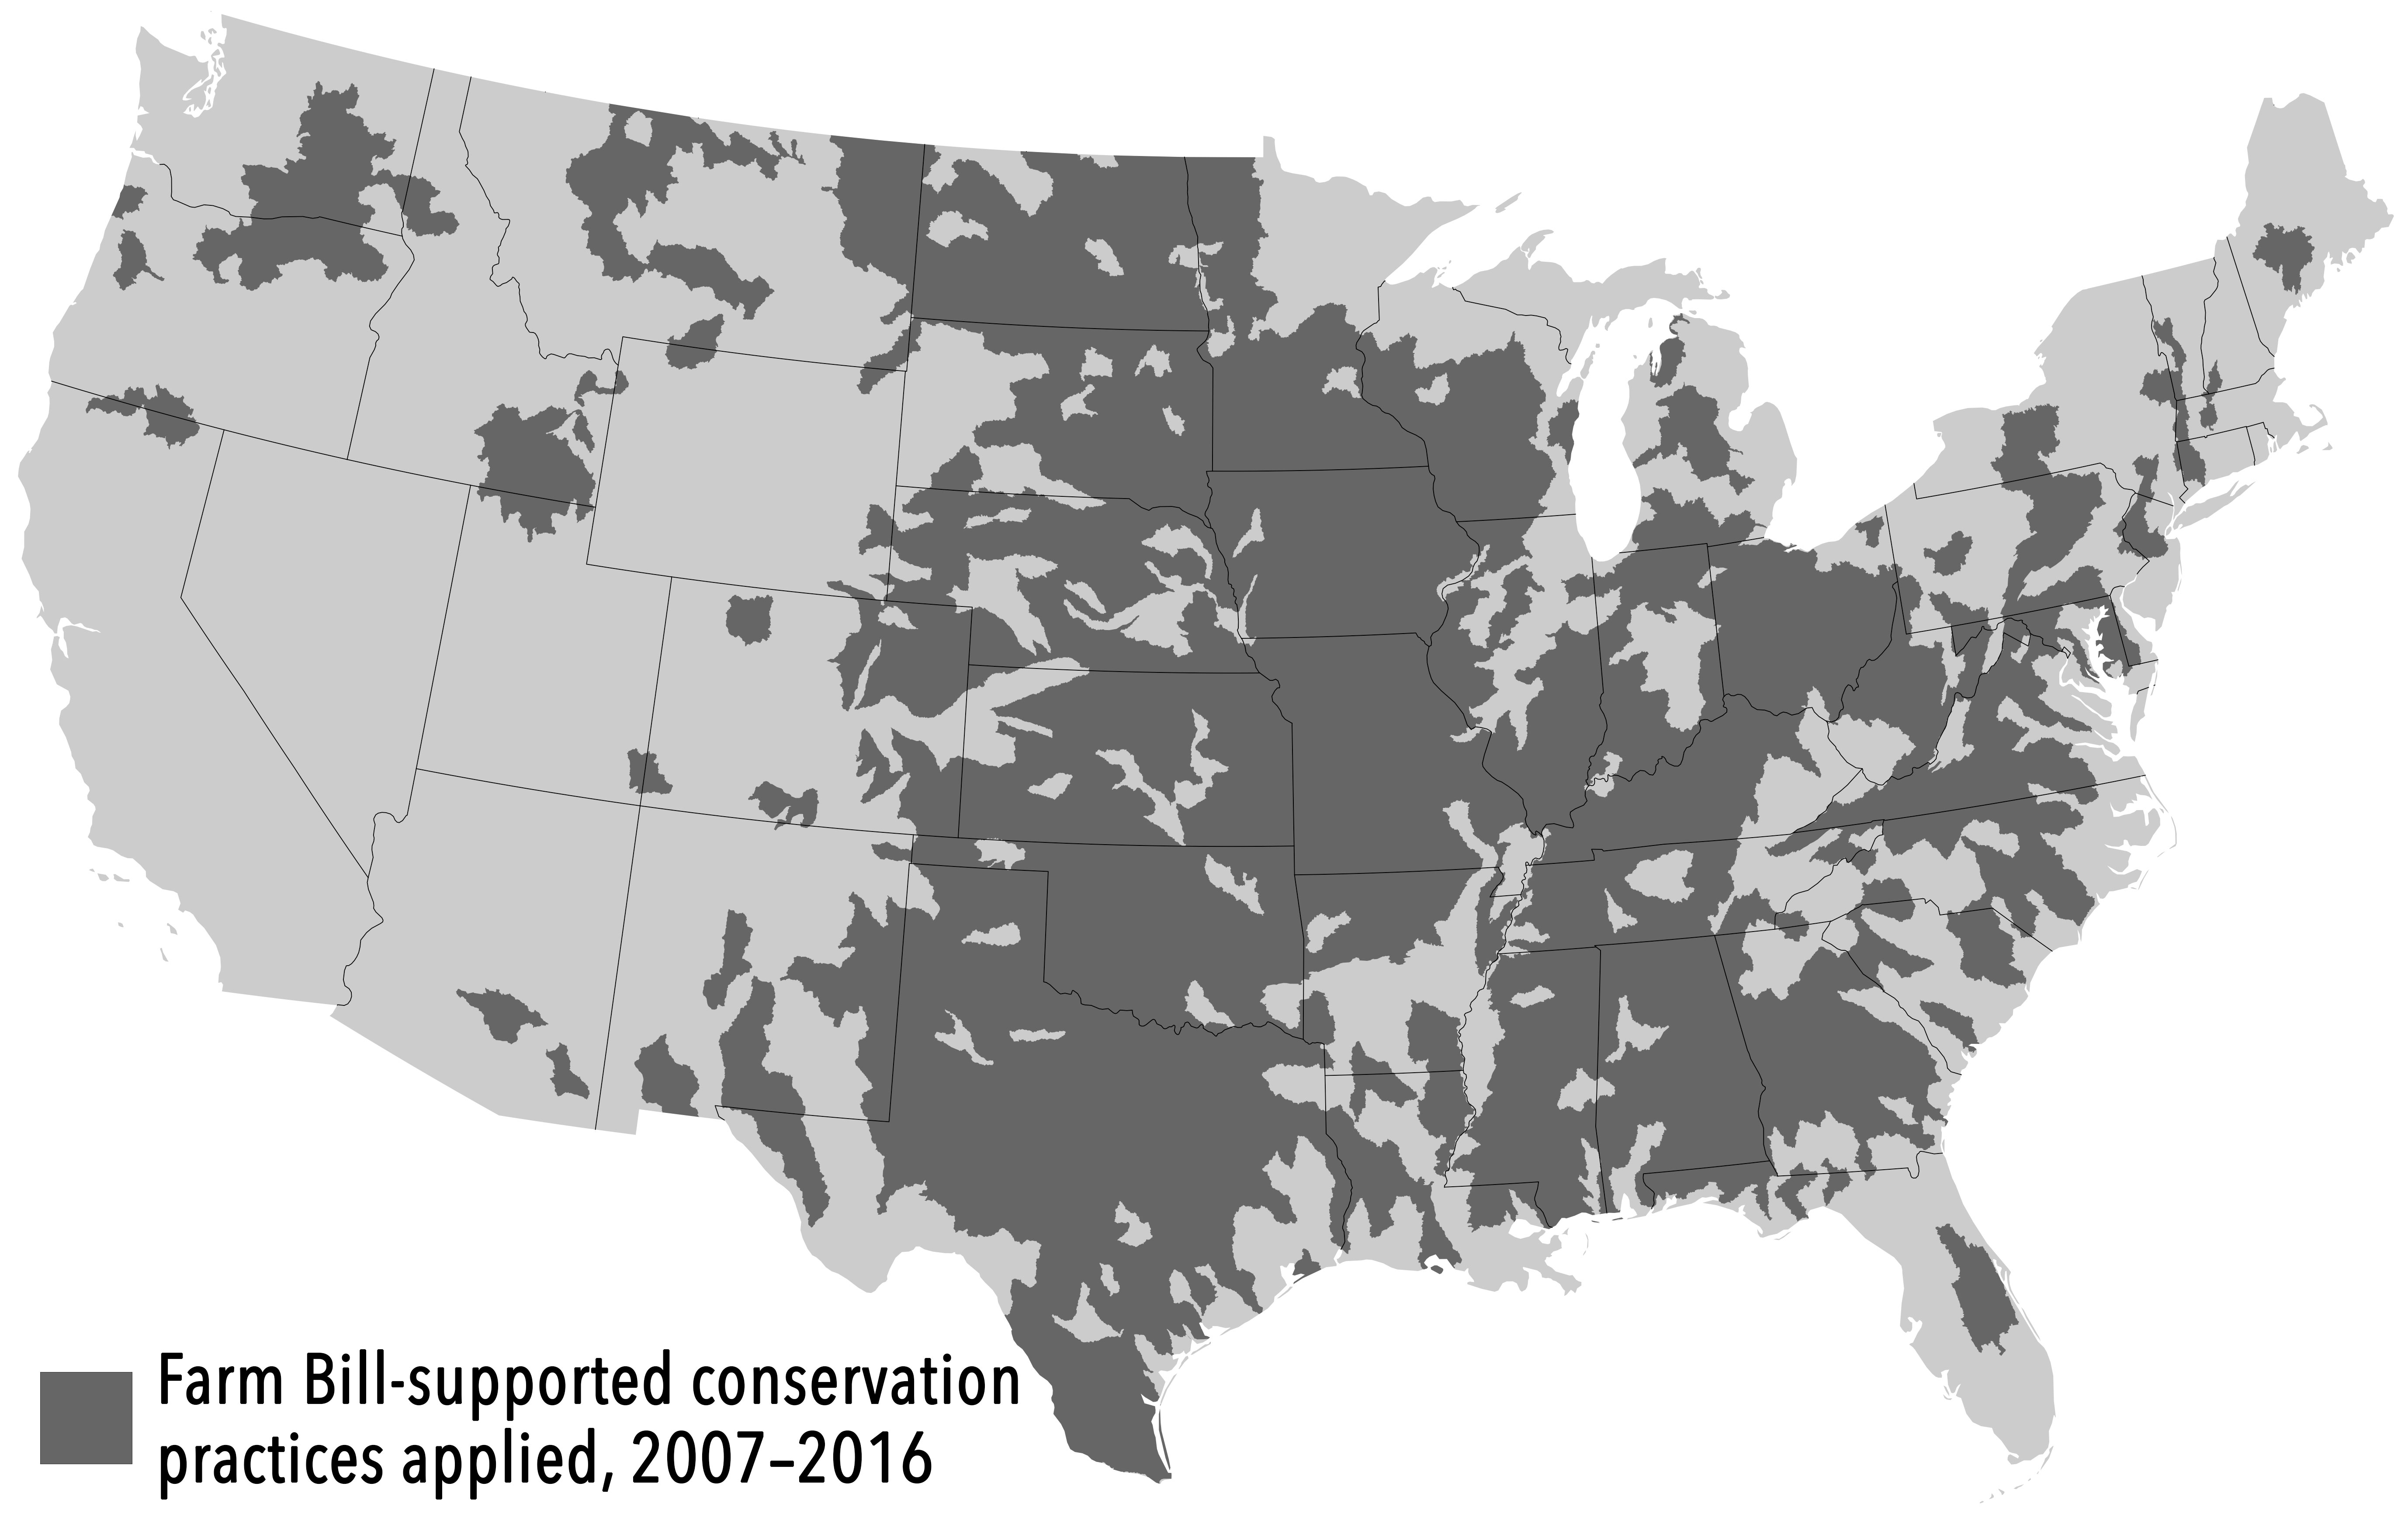
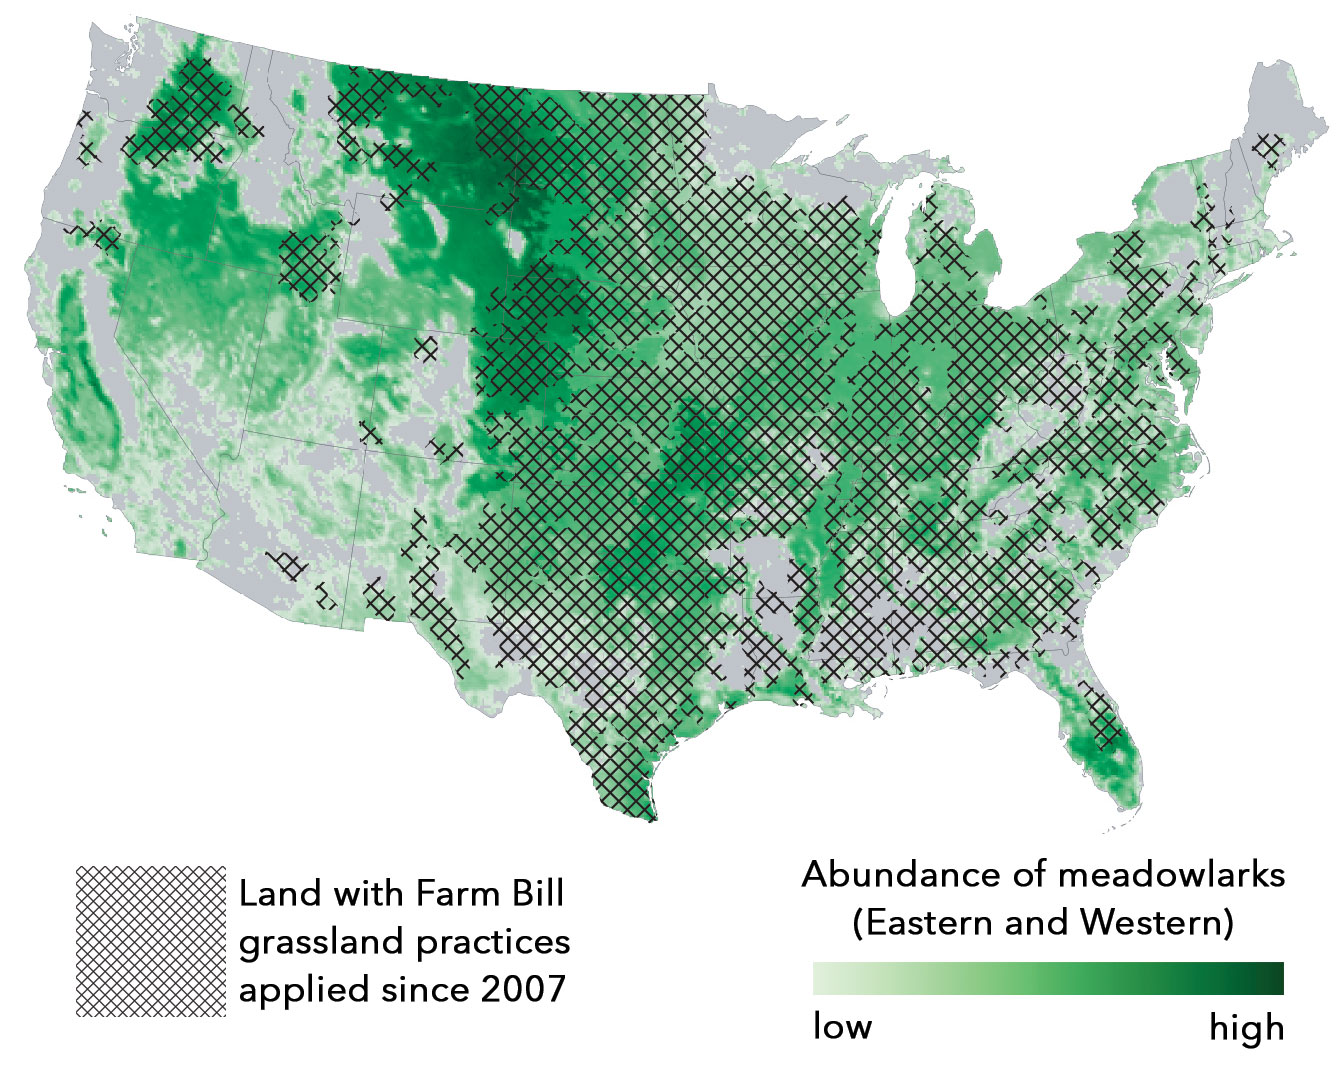
We then overlaid the meadowlark abundance map onto a map of Farm Bill grassland conservation practices, using data provided by the USDA Natural Resources Conservation Service (National Planning and Agreements Database 2017). The shaded area indicated on the map represents 8-digit hydrologic units (HUC8) with at least 1,000 occurrences of conservation practices, applied between 2007 and 2016, that are generally considered to improve grassland bird habitat condition. Spatial data from the hydrologic units were converted to a raster shape file to project on the map. Conservation practices included, along with their conservation practice codes, are:
- Brush Management (Code 314)
- Conservation Cover (Code 327)
- Prescribed Burning (Code 338)
- Pasture and Hay Planting (Code 512)
- Prescribed Grazing (Code 528)
- Range Planting (Code 550)
- Restoration and Management of Rare and Declining Habitats (Code 643)
- Upland Wildlife Habitat Management (Code 645)
View more information on each of these practices.
Shaded areas on the map do not indicate intensity or acreage of conservation practice coverage but do represent the general areas with the greatest frequency of application for these eight important conservation practices. Areas not shaded may have some level of the associated practices applied, but do not meet the 1,000-practice occurrence threshold within HUC8 watersheds. Data are from NRCS conservation assistance activities only and may not include all practices applied through Farm Bill programs not administered by NRCS, such as the Farm Service Agency-administered Conservation Reserve Program.
Bird Population Trend Indicators
The underlying principle of State of the Birds reports around the world is that the health of populations of obligate bird species within a habitat reflects the overall health of that habitat. To assess the health of bird populations, we used data from several continent-scale monitoring programs that have provided consistent data since 1968. For each species, we estimated population change from 1968 to 2015, then combined the estimates of trends for obligate species (species dependent on a single habitat) into a composite estimate of change. This composite estimate of change is used as the bird population indicator of environmental health for the habitat. The statistical approaches we use for estimation of the bird population indicators were first used in the 2009 State of the Birds report, and is similar in form to the bird population indicators used in the United Kingdom State of the Birds reports.
The bird population trend indicators presented in this report extend the analyses presented in the 2014 State of the Birds Report for the same suites of wetland and grassland birds, but are updated with new data through 2015. We have also combined the Eastern and Western Forest Birds indicator from the 2014 report into a single Forest Birds indicator for this report. As in previous reports, we used information from the North American Breeding Bird Survey; the Audubon Christmas Bird Count, and the U.S. Fish and Wildlife Service’s Spring Breeding Ground Waterfowl Survey. Note that the population indicators presented in this report extend the analyses presented in the 2014 State of the Birds Report for the same suites of wetland, forest, and grassland birds. Comparing population trends before and after the initiation of key Farm Bill conservation programs does not imply that population change is a direct result of these programs, but it does suggest that without these Farm Bill programs, bird populations would likely be faring much worse in major habitats across the U.S.